
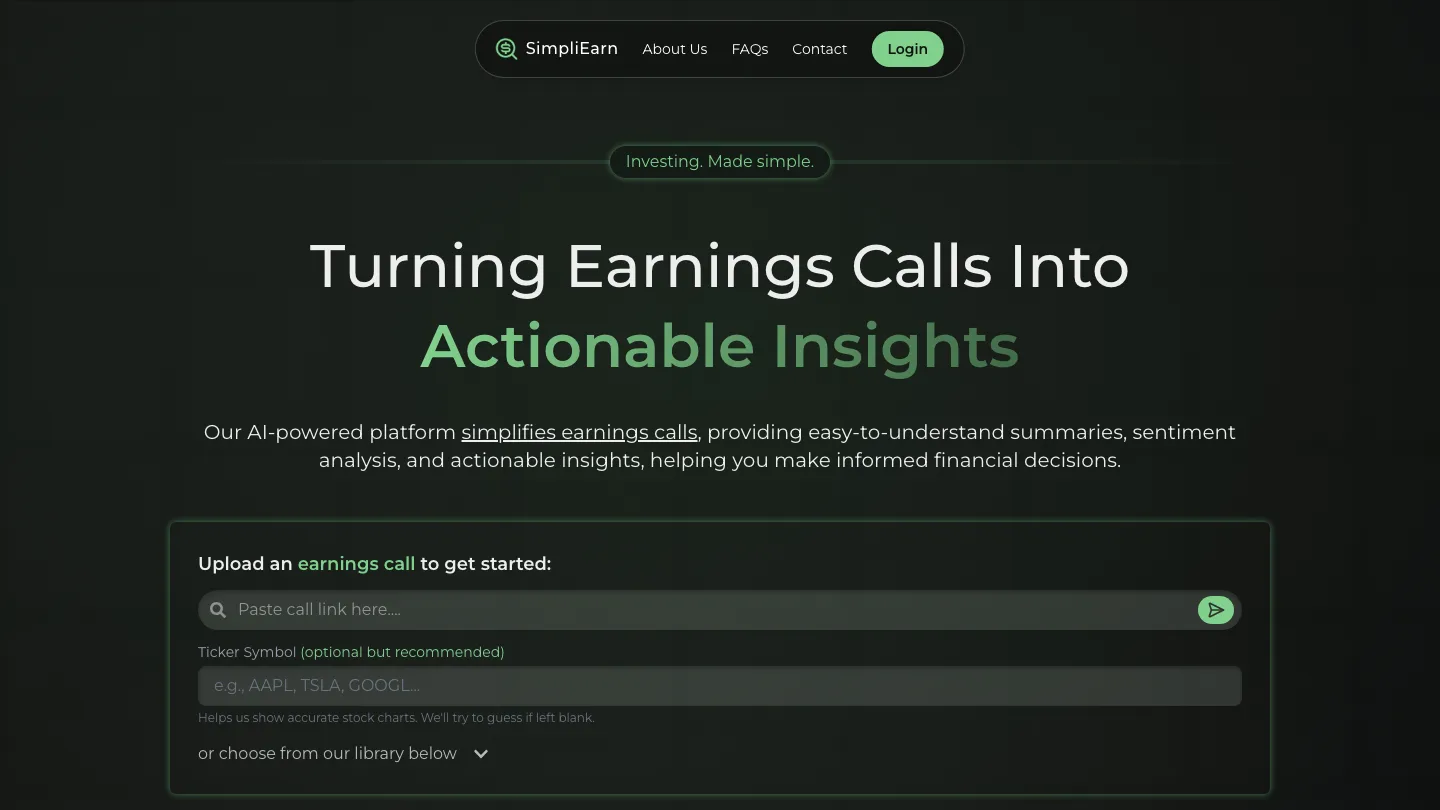
SimpliEarn
Jan 2025 – May 2025
- Next.js
- React
- Python
- Chart.js
SimpliEarn is an AI-powered earnings call analysis platform built by a student project team in Big Data Big Impact, Georgia Tech's data-science club. I worked on the frontend: the dashboard layout, the sentiment graph, and a 48-hour stock chart that shows how the market reacted around each call.
Overview
Earnings calls are long, dense, and full of financial language that's hard to follow if you're new to investing. SimpliEarn takes a call and turns it into a dashboard: the call video, an AI-written summary, a sentiment timeline, a stock chart, and a chatbot you can ask questions about the transcript.
The app is split into three parts:
- Frontend: a Next.js app with Supabase auth.
- RAG API: a FastAPI service for transcript chat and summaries.
- Sentiment API: a FastAPI service that transcribes a YouTube earnings call and runs the sentiment pipeline.
My role
I was on the frontend. I set up the original Next.js app in the club repo, built the dashboard, and wrote the charts. I worked alongside the sentiment-analysis and RAG subteams, who built the models and APIs the dashboard displays. The summary engine, the chatbot backend, the sentiment pipeline, auth, and the later deployment work all came from my teammates.
What I built
- Dashboard layout. I built the dashboard's components: the video tab, the summary frame, and the charts frame. I also built the chatbot panel, which can be opened full-screen or collapsed to an icon. For the first version I hand-loaded data for six dashboards: Tesla, Apple, Google, CVS, Shell, and Walmart.
- Sentiment graph. This Chart.js line chart plots a sentiment score at each timestamp of the call, with a 5-point moving average drawn over it. Every point is clickable: click one and the embedded YouTube video jumps to that moment, so you can hear exactly what was said when sentiment moved.
- Dynamic video loading. The video frame builds its YouTube embed from the call's URL, so the dashboard isn't tied to one hardcoded video.
- 48-hour stock chart. This is a Chart.js chart of hourly prices across the day of the call and the day after. It shows how the stock moved before and after the call, with summary stats for each day and for the whole window.
How it works
For the stock chart, the dashboard posts a ticker and date to a Next.js API route. In the version I built, that route ran a Python script. The script pulls hourly prices from yfinance and lays them on a fixed grid of exactly 48 hourly slots: 24 for the day of the call and 24 for the next day. Each slot takes the most recent price at or before that hour, or the first price after it if there isn't one, so overnight and after-hours gaps don't break the line. It returns the prices, the percentage changes, and per-day min/max/change stats as JSON, and the React component plots them.
The sentiment graph receives a map of call timestamps to sentiment scores. It formats the x-axis as HH:MM:SS and passes a click callback up to the video frame, which seeks to the clicked time.
Later on, the team moved the stock and indicator charts onto the RAG backend and added features on top of the dashboard, including economic indicators and a quarter-over-quarter compare tab.
Tech stack
- Next.js, React, TypeScript
- Chart.js (
react-chartjs-2) - Python,
yfinance, pandas - FastAPI (RAG and sentiment services, built by the team)
- Supabase (auth)
Outcome
SimpliEarn is live at simpli-earn-2.vercel.app. It's still under active development by the club's project team, and the code is public at github.com/gt-big-data/simpli-earn.